An August 2026 snapshot of transactions, sales value and pricing across Dubai’s top developers, and how to read the rankings before you buy
Who are the top real estate developers in Dubai in 2026? The answer depends on how “top” is measured.
A developer can lead Dubai by number of transactions without producing the highest sales value. Another can complete far fewer deals while selling much more expensive property. A luxury developer may close only a handful of sales in a month and still average more than AED 20 million per transaction. A meaningful comparison therefore has to look beyond a single ranking. This guide uses Property Monitor’s August 2026 Dubai developer statistics to compare developers by transaction volume, total sales value, average transaction value, average property size and average price per square foot. For international readers, the dirham is pegged to the US dollar at about 3.67, so AED 1 million is roughly $272,000. The August data shows a highly segmented market. Azizi led transaction volume, and Emaar led total sales value. Nakheel ranked only seventh by number of deals but second by value. Meraas closed just 80 transactions yet sold more than AED 568 million worth of property. And ultra-luxury names such as H&H Development and Omniyat operated at average deal sizes many times higher than the mass-market leaders.
A snapshot, not a permanent league table
Before looking at the numbers, one caution. The rankings below reflect a single month and should not be read as full-year market share. Developer rankings can shift sharply from one month to the next because of project launches, registration timing, bulk unit registrations, construction milestones, handovers and the release of new phases. A developer that launches a major project in August can jump well above its usual position, only to fall back the following month. Treat this article as a picture of August 2026, not a lasting verdict on any developer’s size or quality.
Top developers by transaction volume
The table ranks the leading developers by recorded Title Deed and Oqood transactions. Oqood is the registration system used for off-plan sales, so the data captures both completed and under-construction property.
| Rank | Developer | Transactions | Share of developer volume | Total sales | Avg. sale | Approx. USD | Avg. AED per sq ft |
|---|---|---|---|---|---|---|---|
| 1 | Azizi | 2,274 | 21.7% | AED 1.80B | AED 792K | $216K | 1,740 |
| 2 | Emaar | 1,024 | 9.8% | AED 3.57B | AED 3.49M | $950K | 2,067 |
| 3 | DAMAC Properties | 757 | 7.2% | AED 1.59B | AED 2.10M | $572K | 1,431 |
| 4 | Binghatti | 561 | 5.4% | AED 1.16B | AED 2.08M | $566K | 2,096 |
| 5 | Imtiaz Developments | 478 | 4.6% | AED 485.11M | AED 1.01M | $275K | 1,829 |
| 6 | Sobha Group | 381 | 3.6% | AED 1.24B | AED 3.27M | $890K | 1,946 |
| 7 | Nakheel | 345 | 3.3% | AED 1.85B | AED 5.36M | $1.46M | 2,147 |
| 8 | Samana Developers | 242 | 2.3% | AED 267.43M | AED 1.11M | $302K | 1,436 |
| 9 | Beyond | 226 | 2.2% | AED 410.29M | AED 1.82M | $496K | 1,924 |
| 10 | Danube Properties | 195 | 1.9% | AED 342.99M | AED 1.76M | $479K | 2,062 |
Across the full August report, the ten largest developers accounted for about 61.9% of the roughly 10,474 developer-attributed transactions, and the top 20 for about 73.7%. The top three alone, Azizi, Emaar and DAMAC, represented about 38.7%. Dubai has a very large and growing developer base, yet a relatively small group still handles most of the recorded activity.
Top developers by total sales value
Rank the same market by the dirham value of property sold and the order changes considerably.
| Sales rank | Developer | Total sales | Transactions | Avg. sale | Avg. AED per sq ft |
|---|---|---|---|---|---|
| 1 | Emaar | AED 3.57B | 1,024 | AED 3.49M | 2,067 |
| 2 | Nakheel | AED 1.85B | 345 | AED 5.36M | 2,147 |
| 3 | Azizi | AED 1.80B | 2,274 | AED 792K | 1,740 |
| 4 | DAMAC Properties | AED 1.59B | 757 | AED 2.10M | 1,431 |
| 5 | Sobha Group | AED 1.24B | 381 | AED 3.27M | 1,946 |
| 6 | Binghatti | AED 1.16B | 561 | AED 2.08M | 2,096 |
| 7 | Wasl | AED 605.92M | 181 | AED 3.35M | 1,787 |
| 8 | Meraas | AED 568.26M | 80 | AED 7.10M | 2,836 |
| 9 | Dubai South | AED 498.07M | 101 | AED 4.93M | 1,240 |
| 10 | Ellington Properties | AED 485.92M | 175 | AED 2.78M | 2,336 |
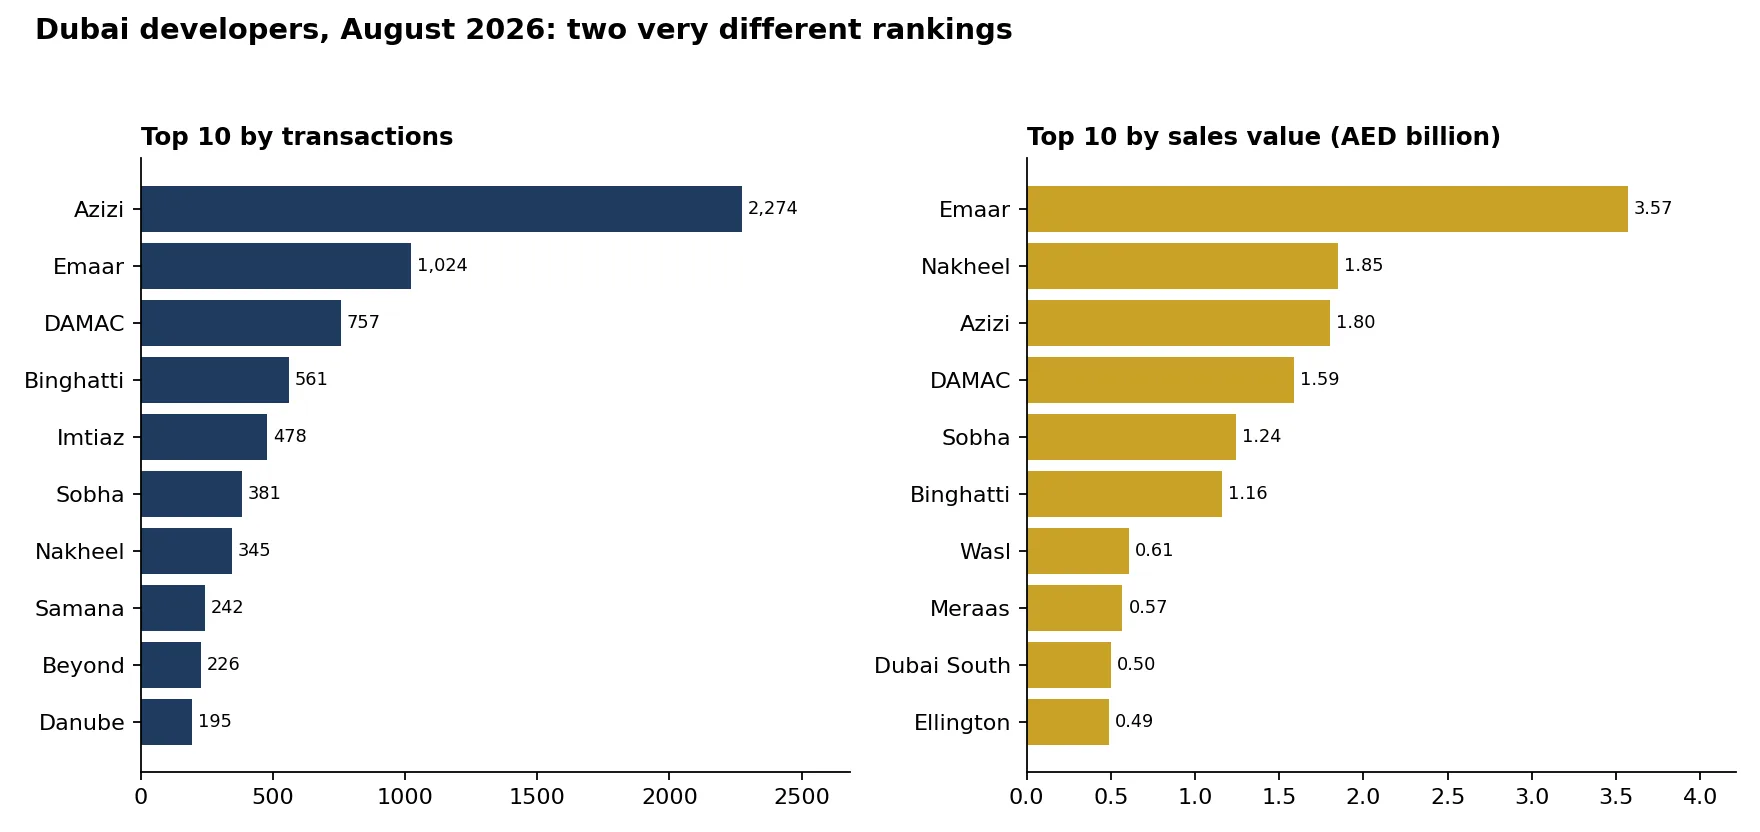
The contrast is striking. Azizi completed more than twice as many transactions as Emaar, yet Emaar generated almost twice Azizi’s sales value, about AED 3.57 billion (roughly $972 million) against AED 1.80 billion. Nakheel is an even stronger example: seventh by transaction count, second by sales value. The gap comes largely from the size and price of the properties being sold.
Why transaction volume is not the same as performance
A high transaction count shows strong market activity. It does not automatically mean better projects, stronger returns, better construction, stronger resale performance or higher capital growth. Volume is heavily shaped by product type: a developer selling hundreds of compact apartments will record far more deals than one selling large waterfront residences, even if the second developer collects much more money per sale. Treat the volume ranking as a market activity ranking, not a quality ranking.
A closer look at the leading developers
Azizi: the volume leader. Azizi Developments recorded 2,274 transactions in August, ranking first by volume and third by value, with AED 1.80 billion in sales. Its average deal was only about AED 792,000 ($216,000), and its average unit was around 469 sq ft, at AED 1,740 per sq ft. That points to a product mix concentrated in compact homes with accessible ticket sizes, which explains how it can dominate volume while trailing Emaar on value. You can browse Azizi Developments projects on our site.
Emaar: number one by value. Emaar Properties recorded 1,024 transactions, second by volume, and the highest total sales at AED 3.57 billion. Its average sale was AED 3.49 million (about $950,000), more than four times Azizi’s, and its average property was much larger at about 1,670 sq ft, priced at AED 2,067 per sq ft. The combination of high volume and a high average ticket gives Emaar an outsized footprint in total sales. See current Emaar projects in Dubai.
DAMAC: volume across a broad price range. DAMAC Properties ranked third by volume and fourth by value, with 757 transactions and AED 1.59 billion in sales. Its average sale was AED 2.10 million, its average unit 1,586 sq ft, and its average price AED 1,431 per sq ft, below Emaar, Binghatti, Sobha and Nakheel that month. Developer-level price per square foot should be read carefully, though. DAMAC operates across many communities and project types, so the figure reflects the mix of properties that transacted in August, not a universal DAMAC price.
Binghatti: compact units at a higher price per foot. Binghatti ranked fourth by volume with 561 transactions and AED 1.16 billion in sales. Its average unit was only 785 sq ft, much smaller than those of Emaar, DAMAC, Sobha or Nakheel, yet its AED 2,096 per sq ft was among the highest of the high-volume developers. This shows why average ticket size alone can mislead: smaller units at relatively high pricing produce a moderate total price despite premium pricing per foot.
Imtiaz Developments: high volume around a AED 1 million ticket. Imtiaz ranked fifth with 478 transactions, AED 485.11 million in sales, an average sale of AED 1.01 million and an average unit of 568 sq ft. Like Azizi, it operates in compact, accessible product, which helps explain the transaction count.
Sobha: a premium ticket with real volume. Sobha Realty ranked sixth by volume but fifth by value, with 381 transactions and AED 1.24 billion. The average sale was AED 3.27 million for about 1,740 sq ft, at AED 1,946 per sq ft. That indicates a more premium mix while still sustaining substantial monthly volume.
Nakheel: lower volume, very high value. Nakheel is perhaps the clearest proof that transaction count cannot be used alone. It completed about one-third of Emaar’s transactions (345), yet generated more sales value than every developer except Emaar, at AED 1.85 billion. Its average transaction of AED 5.36 million (about $1.46 million) was almost seven times Azizi’s, reflecting exposure to a much higher-ticket segment, at AED 2,147 per sq ft.
Samana, Beyond and Danube. Samana Developers recorded 242 transactions and AED 267.43 million in sales, at an average of AED 1.11 million and AED 1,436 per sq ft, which puts it in the accessible, high-volume segment. Beyond recorded 226 transactions and AED 410.29 million, averaging AED 1.82 million and AED 1,924 per sq ft, a mid-market to premium position. Danube Properties recorded 195 transactions and AED 342.99 million, averaging AED 1.76 million for about 965 sq ft at AED 2,062 per sq ft. Danube’s price per foot is similar to that of developers with much higher average tickets, and unit size and project mix explain most of the difference. None of this is a quality judgment; it describes the product being sold.
Lower volume, higher value: Meraas and the luxury tier
Meraas shows the effect of high-value product. It completed only 80 transactions, ranking about 20th by volume, but generated AED 568.26 million, eighth by value. Its average sale was AED 7.10 million (about $1.93 million) for about 2,346 sq ft, at AED 2,836 per sq ft. It out-sold several developers that closed two or three times as many deals. The differences become extreme at the ultra-luxury end. H&H Development completed just 22 transactions but generated AED 471.61 million, ranking around 12th by value, with an average sale of AED 21.44 million (about $5.8 million) and AED 5,791 per sq ft. Omniyat recorded only nine transactions worth AED 255.39 million, an average of AED 28.38 million (about $7.7 million) for 3,734 sq ft, at AED 5,974 per sq ft. LIV Developers, with 52 transactions worth about AED 200.67 million, averaged AED 3.86 million and AED 3,367 per sq ft. It makes little sense to compare such developers with Azizi or Imtiaz on transaction count, because the average property they sell belongs to a different market entirely.
Reading the price-per-square-foot figures
| Developer | Avg. AED per sq ft |
|---|---|
| Azizi | 1,740 |
| Sobha | 1,946 |
| Emaar | 2,067 |
| Binghatti | 2,096 |
| Nakheel | 2,147 |
| Ellington | 2,336 |
| Meraas | 2,836 |
| LIV | 3,367 |
| H&H | 5,791 |
| Omniyat | 5,974 |
These figures should not be read as measures of developer quality. A developer selling beachfront penthouses will naturally record a much higher price per foot than one selling apartments in an emerging suburb. Average price per square foot mainly reflects location, property type, project positioning and unit mix.
Four kinds of Dubai developer
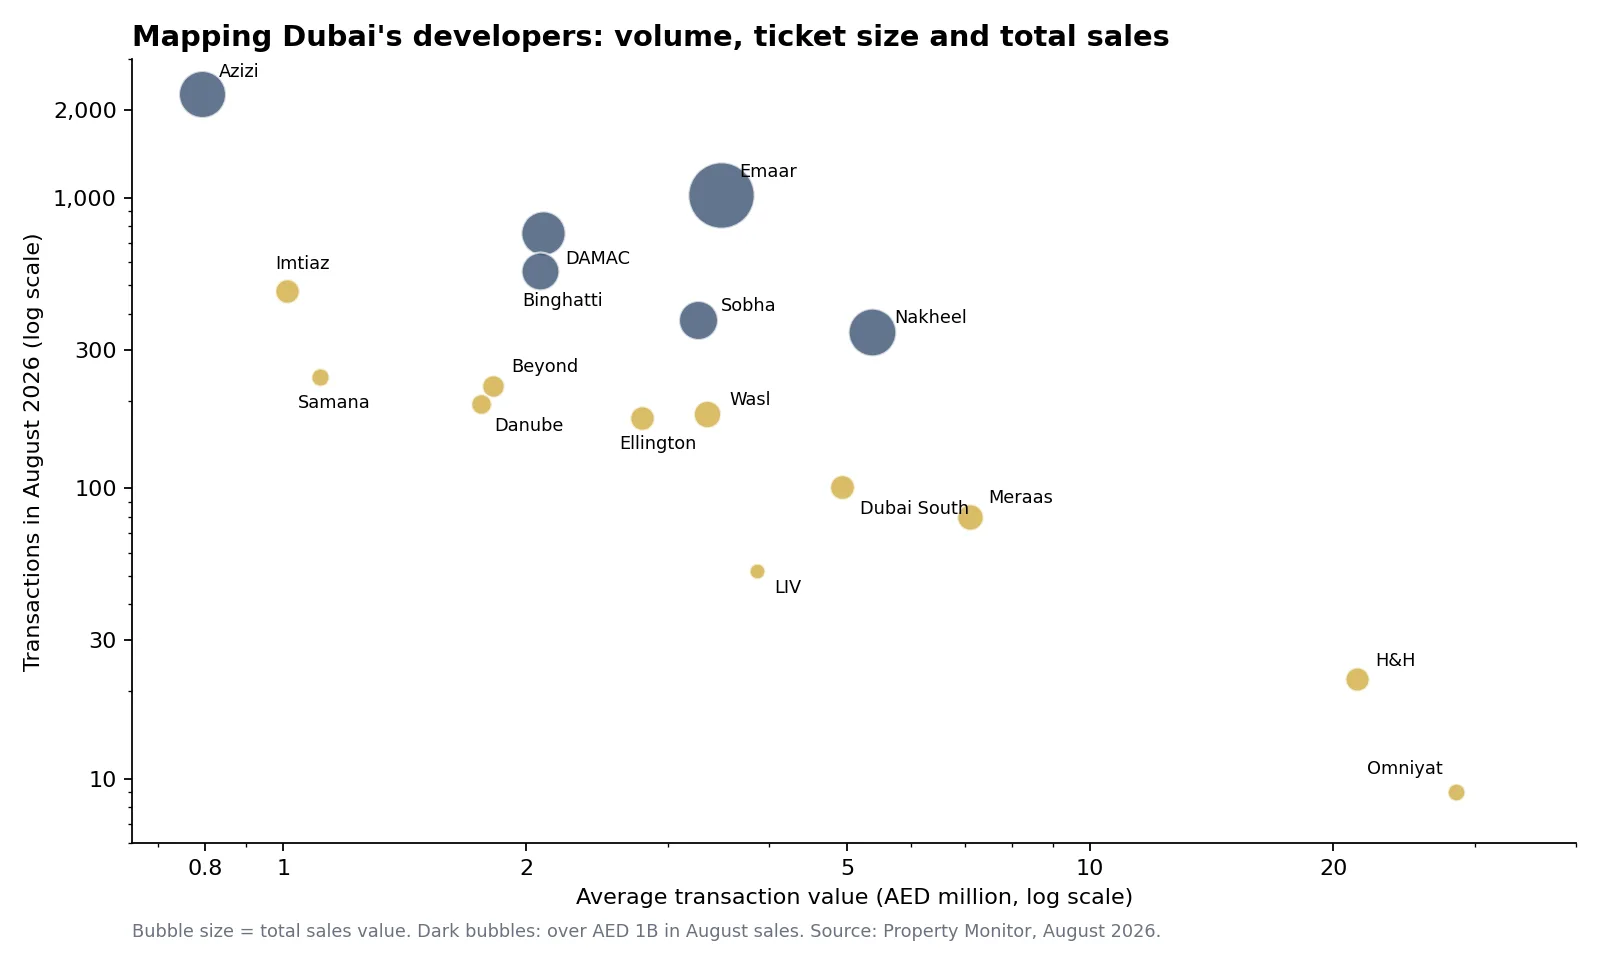
The August data makes it possible to sketch four broad profiles. High-volume, lower-ticket developers such as Azizi, Imtiaz, Samana and Reportage generate large transaction counts at relatively accessible prices. High-volume mainstream and premium developers, including Emaar, DAMAC, Binghatti, Sobha and Nakheel, combine substantial volume with higher sales values, although their portfolios still vary by project. Premium lower-volume developers such as Meraas, Ellington, LIV and Majid Al Futtaim record fewer transactions but at higher average prices. Finally, ultra-luxury developers such as H&H Development and Omniyat can earn hundreds of millions of dirhams from a few deals and should be analysed separately from volume-driven residential developers.
Head to head: Emaar, DAMAC, Binghatti and Sobha
Buyers often compare these four names, and the August numbers show how different their product mixes were.
| Metric | Emaar | DAMAC | Binghatti | Sobha |
|---|---|---|---|---|
| Transactions | 1,024 | 757 | 561 | 381 |
| Total sales | AED 3.57B | AED 1.59B | AED 1.16B | AED 1.24B |
| Average sale | AED 3.49M | AED 2.10M | AED 2.08M | AED 3.27M |
| Average size | 1,670 sq ft | 1,586 sq ft | 785 sq ft | 1,740 sq ft |
| Avg. AED per sq ft | 2,067 | 1,431 | 2,096 | 1,946 |
Binghatti’s average property was much smaller, Sobha’s average deal much larger, and Emaar combined high volume with a high ticket. DAMAC’s price per foot was lower during the month. None of this shows which developer is better; it describes the markets in which their August deals took place. The same lesson applies to Emaar and Nakheel. Emaar recorded 1,024 transactions and AED 3.57 billion at an average of AED 3.49 million, while Nakheel recorded 345 transactions and AED 1.85 billion at an average of AED 5.36 million. They are both major Dubai names, but they are not interchangeable, and project positioning matters. Azizi and Emaar, the top two by volume, were almost opposites: 2,274 deals at AED 792,000 and 469 sq ft on average for Azizi, against 1,024 deals at AED 3.49 million and 1,670 sq ft for Emaar.
Watch the sample size
Averages for luxury developers rest on very small samples. Omniyat’s AED 28.38 million average comes from nine transactions, H&H’s AED 21.44 million from 22, and Meraas’s AED 7.10 million from 80. Comparing nine deals with the 2,274 of a volume developer requires care, and the same applies to price per square foot. A higher figure usually signals a more expensive product and location mix, not better investment performance.
A crowded market: more developers, more competition
Today’s competition did not appear overnight. During 2025, Dubai saw an extraordinary expansion in new development. Property Monitor reported about 648 project launches, introducing more than 167,000 units with an estimated launch value of around AED 463 billion. Roughly 258 developers launched projects, about 40% more than in 2024, and apartments made up around 88.8% of newly launched units. That expansion gave 2026 buyers far more choice, but also raised the importance of selection. When dozens of projects compete in the same price band, developers try to stand out through payment plans, amenities, branding, launch incentives, design, location and handover dates. Investors need to separate a good project from a good marketing campaign, because the two are not always the same thing.
Does high sales volume mean lower risk?
No. Sales volume shows that a developer’s properties were actively transacting in the period. It does not measure financial strength, construction quality, delivery history, service quality, resale performance or post-handover management, all of which need separate due diligence. Equally, low monthly volume does not make a developer weak, since some luxury developers deliberately limit how many residences they release.
How to evaluate a developer before you buy
Developer statistics are a good screening tool, but the decision should be made at project level.
Delivery track record. Check whether the developer has completed earlier projects and delivered major ones broadly in line with promised timelines.
Completed product quality. Visit older finished developments where you can. Marketing renders do not show how a building performs years after handover.
Location and launch price. A strong developer cannot fully offset a weak location or an inflated price. Compare the project’s price per square foot with ready properties, secondary-market sales and competing off-plan launches.
Payment plan. Flexible terms are valuable, but a long payment plan does not justify a much higher purchase price.
Future supply and rental economics. Ask how many similar properties will reach the market at handover, and estimate realistic rent rather than relying on developer projections.
Resale liquidity. Think about who is likely to buy from you later, and why.
Developer ranking is not investment ranking
A ranking by sales volume answers the question of who sold the most units. A ranking by sales value answers who generated the greatest property sales. Neither tells you which developer will produce the best return. That depends on the individual property: an excellent project bought at an excessive price can be a poor investment, while a less fashionable project bought well can outperform. Should investors stick to major developers? Not necessarily. Large, established developers offer extensive delivery histories, brand recognition, big portfolios and established communities. Smaller developers can offer differentiated design, boutique projects, competitive entry prices and limited inventory. The developer’s name should be part of your due diligence, not a substitute for it. Whichever route you take, it helps to cross-check claims against independent data, such as the Dubai Land Department real estate data platform and Property Monitor’s market intelligence platform.
Frequently asked questions
Who is the biggest real estate developer in Dubai in 2026? It depends on the metric. In August 2026, Azizi ranked first by transaction volume with 2,274 deals, while Emaar ranked first by total sales value at about AED 3.57 billion.
Which developer had the highest sales value? Emaar, with approximately AED 3.57 billion in August 2026.
How many transactions did Emaar and DAMAC record? Emaar recorded 1,024 transactions at an average of about AED 3.49 million. DAMAC recorded 757 transactions worth about AED 1.59 billion.
Is Emaar bigger than DAMAC? By the August 2026 metrics, Emaar recorded both higher transaction volume and higher sales value. That is a monthly snapshot, not a full measure of corporate size.
Is Nakheel one of Dubai’s largest developers? It ranked seventh by transaction count but second by sales value in August, and its average deal of about AED 5.36 million indicates a higher-ticket product mix than many volume developers.
Which developer has the most expensive properties? Averages depend on project mix. Omniyat and H&H recorded the highest average deal sizes and prices per square foot in the August data, but on very small transaction samples.
Does buying from a top developer guarantee capital growth? No. Reputation can support demand and liquidity, but returns also depend on location, project, purchase price, supply, rental demand and timing. A major developer’s project can still be overpriced.
Should I buy from a large or boutique developer? Either can work. Large developers generally have longer track records, while boutique developers may offer differentiated or limited-supply products. Judge the individual project and price rather than developer size alone.
Find the right developer and project
Dubai’s developer market is now too varied to judge with one league table. August 2026 shows at least four distinct profiles: high-volume affordable developers, large mainstream and premium developers, lower-volume premium developers, and ultra-luxury developers. The right choice depends on what you are buying and why. Before investing, compare the developer, project, location, price per square foot, payment plan, rental economics and competing supply. You can browse Dubai real estate projects or properties for sale in Dubai, explore the developer pages for Emaar, DAMAC, Binghatti, Sobha, Nakheel and Azizi, or contact California Properties to compare projects against current market data and your investment goals.